|
Exploration & description/Livestock species owned
The tables show that homesteads generally owned more than one species. Thus, the total percent of responses added to 312 (not 100 that would be the case if each homestead owned only one species) showing that homesteads owned on average three types of species.
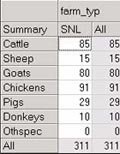
The same results can also be obtained simply by treating each response variable separately. Thus using Stats → Summary Statistics → Frequency Tables in GenStat for the factor 'Cattle' in CS11Data1 the number of the sampled homesteads that possessed cattle can be derived. Thus, again we see that 85% of the homesteads sampled kept cattle; the remaining 15% kept sheep, goats, etc., but not cattle. |
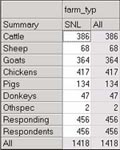
 By using Statistics → Tables → Multiple response... to produce the dialog box below Instat can generate the multiple response table for the numbers of homesteads that kept the different species as shown below. By a slight modification of the dialog box the table of percentages of homesteads that kept the different species can also be obtained.
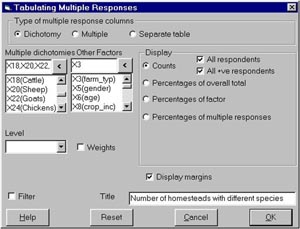 Chickens were owned in the majority (92%) of the homesteads, followed by cattle (85%) and goats (80%). The other species were owned by fewer homesteads.
![]()
![]()
![]()